
🎧 Part I Podcast free on Spotify.

🎧 Part II Podcast episode for paid subscribers only. Also available on Spotify.
To listen to paid episodes in Apple or Spotify, link your Substack subscription via the show settings on those platforms (instructions inside the Substack app under Subscriptions → Podcast).
Table of Contents
1. The most consequential release of the four came out as a technical fact sheet
2. What the numbers actually mean
3. The IRA redesign, and where the risk went
4. What the demonstration was actually doing
5. The 6 percent cap is a price control on the wrong variable
6. The plan exodus and the vanishing distribution channel
7. Low income subsidy reassignment, the churn nobody talks about
8. Who buys, and the uncomfortable concentration problem
9. Businesses that fall out of this
10. Ways this thesis breaks
11. Dates to put on the calendar
Abstract
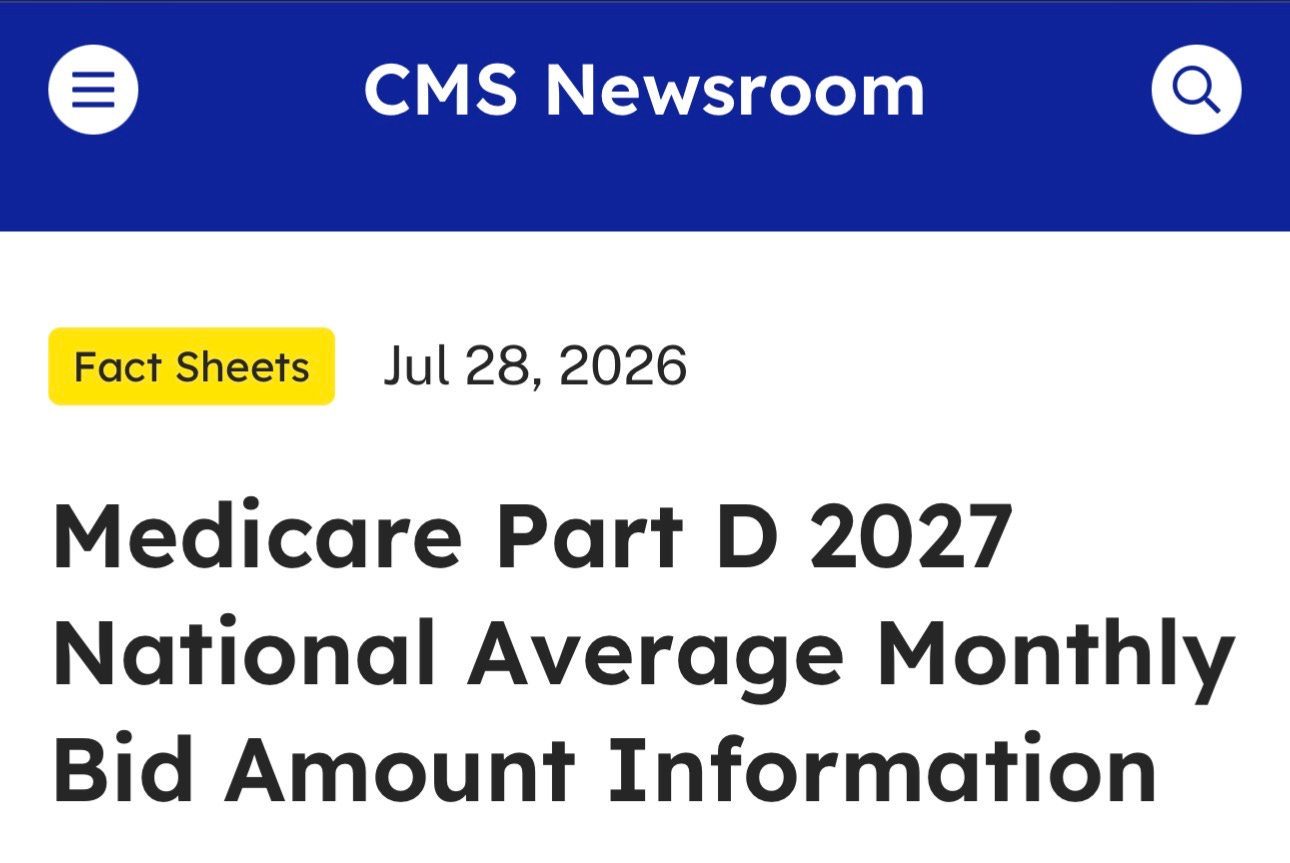
On July 28, 2026, CMS published the Medicare Part D 2027 National Average Monthly Bid Amount information. The NAMBA for CY 2027 is 296.05 dollars and the base beneficiary premium is 41.33 dollars, the latter being exactly 6 percent above the prior year, which is the statutory maximum increase permitted under the Inflation Reduction Act’s premium stabilization provision through 2029. Buried in the same release: CMS is terminating the Part D Premium Stabilization Demonstration at the end of CY 2026, on the stated basis that plan sponsors now have sufficient experience under the redesigned benefit to bid without support. CY 2027 therefore becomes the first year the standalone prescription drug plan market operates under fully exposed IRA economics. Context matters here. The standalone PDP market covers roughly 25 million enrollees. The number of standalone PDPs fell from 709 in 2024 to 360 in 2026. Critics at the Paragon Health Institute put the demonstration’s cost at roughly 5 billion dollars and estimate standalone premiums would have risen close to 600 percent from 2023 to 2026 absent intervention. Several major carriers have cut or eliminated broker commissions on PDPs. The final 2027 landscape arrives mid-to-late September 2026, with Open Enrollment running October 15 through December 7. This essay covers what the numbers say, where the risk actually moved under the redesign, and what can be built in the gap between a repriced product and a distribution channel that no longer exists.
1. The most consequential release of the four came out as a technical fact sheet
CMS publishes bid information every summer. It is a routine document. Plan sponsors need it to finalize offerings before Open Enrollment, actuaries need it to true up their models, and roughly four people outside that circle read it. The fact sheet has no press conference, no accompanying blog post, and no advocacy group issuing a statement within the hour.
Which is a good reminder that the loudest release is rarely the most important one. Two payment rules came out the following day with far more coverage and considerably less consequence, and this document, formatted like a table of technical parameters, quietly announced the end of the mechanism that has been holding the standalone drug plan market together for two years.
The termination of the Premium Stabilization Demonstration is a genuine forcing event. Not in the sense that something dramatic happens on January 1, 2027, because it will not. In the sense that a market that has been operating on training wheels since CY 2025 now has to price, staff, and sell a product whose underlying economics were fundamentally rewritten by the Inflation Reduction Act, without the cushion that made the transition survivable. Repricing events are where new intermediaries get built, and this is a large one happening in a market with 25 million people in it and a distribution channel that has been actively dismantling itself.
2. What the numbers actually mean
Two figures, and the relationship between them is the whole story.
The National Average Monthly Bid Amount is the enrollment-weighted average of the standardized bids submitted by Part D sponsors for basic coverage. It represents what the plans, collectively, believe it costs to deliver the defined standard benefit. For CY 2027 that number is 296.05 dollars.
The base beneficiary premium is the statutory starting point for what a beneficiary pays. It is calculated to represent approximately 25.5 percent of expected basic benefit costs, with the government picking up the rest through the direct subsidy. For CY 2027 that number is 41.33 dollars.
Subtract and the picture gets interesting. The average bid is 296.05 dollars, the base premium is 41.33 dollars, and the difference, roughly 254.72 dollars, is what the federal government contributes per member per month on average through the direct subsidy before any risk adjustment, reinsurance, or low income subsidy payments are layered on. The beneficiary is nominally responsible for 25.5 percent of basic benefit cost. The actual base premium works out to something closer to 14 percent of the average bid.
That gap is not an accounting error. It is the premium stabilization provision of the IRA doing exactly what it was designed to do, which is cap the annual growth in the base beneficiary premium at 6 percent per year regardless of what happens to underlying cost. The arithmetic is clean enough to verify without a model: the base premium was 36.78 dollars in 2025, 6 percent above that is 38.99 dollars for 2026, and 6 percent above that is 41.33 dollars for 2027. The cap has been binding every single year since it took effect, which is the most important fact in the release and appears nowhere in it.
Two implications follow. First, beneficiaries have not experienced the cost trend in this program, and consequently there has been no political feedback loop from it. Second, the wedge between the beneficiary premium and actual plan cost is being absorbed by the federal government, which is precisely the outcome the demonstration’s critics objected to, and which the cap will keep producing after the demonstration ends.
One clarification worth making, because it gets confused constantly. The 6 percent cap applies to the base beneficiary premium, not to what any individual plan charges. Plan-specific premiums vary above and below the base depending on whether a sponsor bids above or below the national average, and there is no cap on that variation. A sponsor that needs more revenue can bid higher and charge the difference. That is the pressure valve, and it is why the headline base premium number can look tame while individual plan premiums move sharply.
3. The IRA redesign, and where the risk went
None of this makes sense without the redesign, and the redesign is where the actual business logic lives.
Before 2025, the catastrophic phase of Part D worked like this. Once a beneficiary blew through the threshold, the beneficiary continued paying 5 percent coinsurance with no ceiling, the plan was on the hook for 15 percent, and the federal government covered the remaining 80 percent through reinsurance. Read that allocation carefully. In the phase where the truly expensive drugs live, the plan carried 15 cents on the dollar. Which meant that from a plan’s perspective, a member on a 400,000 dollar per year cell therapy was expensive but not catastrophic to the P and L, and the incentive to manage that spend aggressively was blunted by the fact that somebody else was paying for most of it. The whole system had a hole in it where the risk was supposed to be, and everyone knew it, and the manufacturers priced accordingly.
The IRA rebuilt it. Beneficiary out of pocket costs are now capped, at 2,000 dollars in 2025 and indexed upward thereafter, so beneficiary catastrophic coinsurance is zero. Government reinsurance dropped from 80 percent to 20 percent for applicable drugs, meaning brands and biologics, and to 40 percent for non-applicable drugs. Plan liability in the catastrophic phase went from 15 percent to 60 percent for applicable drugs and 40 percent for the rest. Manufacturers were pulled in through a discount program contributing 10 percent in the initial phase and 20 percent in catastrophic for applicable drugs.
Plan liability in the catastrophic phase quadrupled. That single change is the reason for everything else in this essay.
Consider what it does to the actuarial problem. Under the old structure, a plan’s exposure to a very high cost member was capped in practice by the 80 percent reinsurance, which meant the tail of the cost distribution was mostly the government’s problem and the plan’s job was managing the middle. Under the new structure, the tail belongs to the plan. High cost specialty utilization, which is precisely the fastest growing and least predictable component of drug spend, now lands directly on sponsor economics. And it lands in a benefit design where the beneficiary, having hit the out of pocket cap, has zero remaining financial incentive to prefer a cheaper alternative.
For standalone PDPs this was close to an extinction level change. A standalone drug plan has no medical benefit to cross-subsidize with, no supplemental benefit levers, no way to recover drug spend through reduced hospitalization on the medical side, and no rebate dollars from Part C to deploy. It is a pure pharmacy risk product. Handing a pure pharmacy risk product four times its former catastrophic exposure and telling it to keep premiums flat is not a viable instruction, which is why the bids came in the way they did and why CMS built a demonstration in the first place.
Medicare Advantage prescription drug plans absorbed the same change with vastly more shock absorbers. That asymmetry, more than anything else, explains the market structure this essay is about.
4. What the demonstration was actually doing
The Part D Premium Stabilization Demonstration launched for CY 2025, applied to standalone PDPs on a voluntary basis, and did three things.
It provided a flat per member per month premium reduction to participating standalone plans, funded federally. It capped how much a plan’s premium could increase year over year, so that a sponsor whose true bid implied a very large increase could not pass the full amount through. And it narrowed the risk corridors, meaning the federal government absorbed a larger share of the difference between a plan’s projected and actual costs than the standard corridor structure would have allowed.
That third piece is the one an actuary cares about most and the one that got the least attention. Narrowed corridors do not merely subsidize price, they subsidize uncertainty. A sponsor trying to price a benefit it had never operated before, in a redesigned structure with no historical experience to model against, was effectively given partial insurance against being wrong. Remove that and pricing error becomes fully the sponsor’s problem, which is a meaningfully different underwriting posture even holding the subsidy dollars constant.
The demonstration was extended into CY 2026 in modified and somewhat trimmed form. Now it ends on December 31, 2026.
CMS’s stated rationale is that the bid analysis shows sponsors now have sufficient experience under the redesigned benefit to price without support, and that CY 2027 returns the standalone market to traditional market conditions. The Administrator characterized the termination as ending a bailout and stated that most beneficiaries will see premium increases of less than 10 dollars, with some seeing decreases. Paragon Health Institute, which has been the loudest critic, put the cost at roughly 5 billion dollars and argued the demonstration was an abuse of demonstration authority used to conceal IRA-driven premium increases that would otherwise have approached 600 percent from 2023 to 2026.
Both characterizations can be simultaneously true, which is the honest read. The demonstration did spend federal money to mask a price increase caused by a different federal policy. It also prevented a disorderly collapse of the standalone market during a transition year, which is a defensible thing for a regulator to do. Whether two years was the right duration is a judgment call, and reasonable actuaries land in different places.
What is not a judgment call is that the cushion is gone as of January 1, 2027, and the underlying cost structure that required a cushion has not changed.
5. The 6 percent cap is a price control on the wrong variable
Here is the mechanism that will drive most of the commercial activity over the next three years, and it is genuinely underappreciated outside the actuarial community.
Costs are rising. The beneficiary premium cannot rise more than 6 percent per year through 2029. Sponsors need to close the gap somewhere.
They will not close it primarily through headline premiums, because headline premiums are the thing beneficiaries shop on, plan finders sort by, and journalists write about. They will close it through benefit design, which is invisible until a member tries to use it.
That means tighter formularies with fewer covered alternatives per class. More utilization management, meaning prior authorization, step therapy, and quantity limits applied to more drugs and applied more strictly. Narrower pharmacy networks with preferred cost sharing concentrated in a smaller set of chains and mail order. Higher cost sharing tiers within the deductible and initial coverage phases, where the out of pocket cap does not protect the member. Aggressive specialty pharmacy channel management. And, at the margin, deliberate benefit design choices intended to be unattractive to high utilizers, which is a polite way of describing risk selection through product architecture.
The economic term for what this produces is non-price rationing. Suppress the price and the market clears on some other dimension, and the other dimension here is friction experienced by a 74 year old trying to fill a prescription.
Every unit of that friction is a business. Not metaphorically. Prior authorization navigation, appeals support, formulary exception assistance, pharmacy switching tools, therapeutic alternative identification at the point of prescribing, and patient assistance program matching all become more valuable in direct proportion to how much friction sponsors introduce. This has been true in commercial insurance for a decade and is about to become true in a Medicare population that is older, less digitally fluent, more likely to be on eight medications, and considerably less equipped to fight a denial.
And then the cliff. The 6 percent cap expires after 2029. Whatever gap has accumulated between the capped base premium and actual cost by that point either gets released into beneficiary premiums in a single year, or Congress does something, and Congress doing something about Medicare drug premiums in an election cycle is not a thing to model with confidence. Anyone building here should treat 2029 as a date with genuine structural risk attached, in both directions.
6. The plan exodus and the vanishing distribution channel
709 standalone PDPs in 2024. 360 in 2026. That is a 49 percent reduction in the plan menu in two years, and it is without precedent in the program’s history.
Some consolidation was healthy. The pre-IRA standalone market had a well documented plan proliferation problem, with sponsors offering three or four nearly indistinguishable products in the same region, which produced choice overload without producing meaningful choice. Research on Part D decision making has consistently found that beneficiaries facing dozens of options make worse selections than beneficiaries facing a handful, and that most enrollees leave real money on the table by not switching when a better option appears. Fewer plans is not automatically worse.
But a 49 percent cut is not a rationalization, it is an exit. Sponsors looked at pure pharmacy risk under the redesigned benefit, compared it to the economics of an MA-PD product where drug risk sits inside a much larger and better hedged book, and reallocated. The strategic logic is obvious and the effect is that the standalone product is becoming a residual category serving the people who, for whatever reason, will not or cannot go into Medicare Advantage: beneficiaries who want unrestricted provider access under traditional Medicare, beneficiaries in areas with weak MA networks, and dual eligibles and low income subsidy recipients who land in standalone plans through the benchmark and reassignment machinery.
Then the second thing happened. Several major carriers cut or eliminated broker commissions on standalone PDPs.
This deserves more attention than it received. Broker compensation on PDPs was always small, a few dozen dollars per enrollment against several hundred for an MA-PD, which is exactly why the cut was easy to make and exactly why its effect is so large. An independent agent has finite hours in the Annual Election Period. Given a product that pays little and a product that pays multiples of it, the agent’s rational allocation is not ambiguous. Cutting PDP commissions does not merely reduce PDP sales effort, it converts every remaining agent conversation into a soft push toward Medicare Advantage, which is presumably not an accident.
So stack the conditions for the fall of 2026. Roughly 25 million people, holding a product whose price is about to move without a subsidy behind it, choosing from a menu that has been cut nearly in half, with formularies and networks tightening underneath the headline number, and with the human advisory channel that most of them have historically relied on now economically disinclined to help.
More consequential decisions, fewer advisors, less transparency about what actually changed in the benefit. That is a distribution vacuum, and distribution vacuums in senior health insurance have been the origin of some very large companies.
7. Low income subsidy reassignment, the churn nobody talks about
One mechanic deserves its own section because it is where the most acute member disruption is going to occur and where almost nobody is building.
Low income subsidy beneficiaries, including full dual eligibles, are enrolled in standalone plans whose premiums fall at or below a regional low income premium subsidy benchmark, calculated as a weighted average of premiums in each region. Plans at or under the benchmark can enroll LIS beneficiaries at zero premium. Plans above it cannot, subject to a de minimis provision that allows a plan slightly over the benchmark to waive the difference and stay in the zero premium pool.
When a plan’s premium moves above the benchmark and it does not waive, its LIS enrollees get automatically reassigned to a qualifying plan. They do not choose. They receive a letter. And the new plan has a different formulary, a different pharmacy network, and different utilization management rules.
Now compress that machinery into a market with 360 plans instead of 709. Fewer plans means fewer benchmark-qualifying plans in any given region, which means reassignment concentrates into a smaller set of receiving plans, which means a benchmark plan can absorb a large volume of new LIS members in a single January, all of whom arrive with existing therapy on a formulary that may not cover it. Add a repricing year where sponsors are bidding without demonstration support, which makes benchmark status less stable than usual, and the volume of reassignment could be unusually high.
The population being moved is the population least equipped to handle it: low income, disproportionately high in chronic disease burden, frequently on multiple maintenance medications, often without a family member managing their coverage, and unlikely to open the letter.
The failure mode is not abstract. It is a member arriving at a pharmacy counter in early January and being told their medication now requires prior authorization under a plan they did not know they had joined. Transition fill requirements exist and provide a temporary supply, but they buy weeks, not a solution, and they only work if the pharmacy processes them correctly.
Nobody owns this problem commercially. The plan receiving the members has a bad member experience and a call center spike. The pharmacy has an angry customer and an unpaid claim. The prescriber has a fax. The member has no medication. There is a real business in managing reassignment transitions cleanly, and the buyers are the receiving plans, the pharmacy chains, and the state agencies and health plans managing dual eligible populations, all of whom currently absorb the cost of this going badly and none of whom have a product for it.
8. Who buys, and the uncomfortable concentration problem
Before the business list, the honest assessment of the buyer landscape, because this market has a structural feature that kills a lot of otherwise sound theses.
Part D sponsorship is extraordinarily concentrated. A small number of organizations account for the large majority of standalone enrollment, and every one of them is a very large, very sophisticated company with substantial internal actuarial capability, an owned or affiliated PBM, and a procurement process designed to grind vendors. Selling bid optimization software or drug cost forecasting to plan sponsors means selling to roughly a dozen buyers, several of whom own the PBM that already provides the analytics, and all of whom will happily pilot a product for eighteen months without buying it.
That is not an impossible market. It is a market where a founder needs to be honest that the sales cycle is measured in years, the reference customer is everything, and the outcome distribution is bimodal: either land two of the top five sponsors and have a real company, or land none and have a nice product.
The consumer side has the opposite shape. Twenty-five million potential end users, no gatekeeper, and an acquisition cost problem that has bankrupted a long line of companies. Senior health insurance customer acquisition is brutally expensive, the market is seasonal in a way that concentrates spend into a ten week window, the regulatory environment for marketing is tight and has tightened further, and the churn economics only work if the relationship persists across multiple enrollment cycles.
The realistic third path is selling to entities that already own the relationship: health systems and physician groups with senior patient panels, pharmacy chains with a counter conversation happening anyway, employers and unions administering retiree benefits, area agencies on aging and state health insurance assistance programs, and the MA plans absorbing the displaced. Borrowed distribution beats bought distribution in this population by a wide margin, and every failed direct to consumer Medicare startup learned that lesson at considerable expense.
9. Businesses that fall out of this
Sorting the above into things that can actually be built.
Plan comparison and enrollment guidance for a market that is harder to shop than it has ever been. The pitch is not a nicer plan finder. It is a product that reads the member’s actual medication list, models total annual cost under each available plan including deductible phase cost sharing, formulary tier placement, utilization management requirements, and pharmacy network status, and produces the one number that matters, which is what this person will actually spend next year. That analysis has always been possible and has almost never been done well, because the incentive of the entities doing the comparing has usually been commission rather than accuracy. In a year when commissions on the product are being cut anyway, a genuinely independent model becomes more viable, and the distribution path runs through the trusted institutions listed above rather than through television advertising.
Prior authorization, appeals, and formulary exception navigation for beneficiaries, which is the direct consequence of the price control described in section five. Sponsors will manage cost through friction. Somebody should be on the other side of that friction, and the buyer may not be the beneficiary. Health systems eat the administrative cost of appeals today, specialty pharmacies lose fills to abandonment, and manufacturers lose revenue every time a patient walks away from a therapy at the counter. All three have budget and all three are easier to sell than a 76 year old.
Medication cost management sold to plan sponsors on the basis of catastrophic phase liability. This is the highest value and hardest sale. Plans now carry 60 percent of applicable drug costs above the cap, which converts drug cost management from a rebate optimization exercise into a solvency exercise. Biosimilar conversion programs, specialty site of care and channel management, therapeutic interchange, and adherence programs that demonstrably prevent expensive utilization all have a bigger and clearer buyer than at any point in the program’s history. The requirement is verifiable savings against a credible counterfactual, because the buyer has an internal actuarial team whose job is to disbelieve the vendor’s number.
Actuarial and bid analytics for the sponsors that remain, with the concentration caveat fully acknowledged. What is genuinely needed is better modeling of catastrophic phase liability under the new allocation, enrollment mix shift simulation under a shrinking plan menu, and forecasting around Maximum Fair Price drugs entering the market through negotiation, which introduces a pricing dynamic nobody has historical data on. Small buyer universe, high value per deal.
Medicare Prescription Payment Plan administration, which is the most underrated item on this list. The smoothing program lets beneficiaries spread out of pocket costs across the plan year in monthly installments rather than paying a large amount in January. It is operationally messy: it requires election processing, likely to benefit notifications, monthly billing, reconciliation with the pharmacy, and handling of members who stop paying, which creates a bad debt exposure that plans did not previously have. Uptake has been modest so far and will grow as beneficiaries encounter larger front loaded cost sharing under tightened benefit designs. Administration, member communication, and the bad debt management around it is unglamorous back office infrastructure that plans will outsource because nobody wants to build it.
Reassignment and transition management, per section seven. Nobody owns it, several parties suffer from it, and it happens every January on a predictable schedule.
And the MA-PD migration stack, since the structural flow is toward Medicare Advantage and every displaced standalone enrollee is a prospective MA-PD member. Enrollment platforms, risk adjustment infrastructure, supplemental benefit administration, and crossover management during the compressed fall window all benefit. This is the highest certainty item on the list and correspondingly the most crowded.
10. Ways this thesis breaks
Premiums might not spike. The Administrator’s stated expectation is that most beneficiaries see increases under 10 dollars, and CMS has visibility into the bids that nobody outside the agency has. If that estimate holds, the consumer disruption thesis weakens considerably and the enrollment navigation opportunity is much smaller than the setup suggests.
Congress could intervene. Large Medicare drug premium increases in an election year are the kind of thing that produces legislation quickly, and a reinstated stabilization mechanism under a different name is entirely plausible. Building a business whose value depends on beneficiaries experiencing pain is building against a political system specifically designed to prevent that.
Negotiation could bend the curve. Maximum Fair Price drugs entering the market reduce plan liability on exactly the high spend products driving catastrophic exposure. The magnitude and timing are uncertain, but the direction offsets some of the pressure this essay assumes will persist.
The exits could stop. Two years of contraction may have already removed the sponsors who were going to leave, and the remaining 360 plans may be the ones with viable economics. A stable menu in 2027 undercuts the distribution vacuum argument.
The concentration problem is real and does not go away. A dozen sponsor buyers, several vertically integrated with their own PBM analytics, is a hard enterprise market regardless of how good the product is.
And the consumer acquisition math has defeated better funded companies than whoever reads this. Ten week selling season, expensive channels, tight marketing regulation, and a population that trusts institutions over apps. The opportunity is real. The default outcome is still failure.
11. Dates to put on the calendar
July 28, 2026 was the release: NAMBA at 296.05 dollars, base beneficiary premium at 41.33 dollars, and the announcement that the Premium Stabilization Demonstration ends after CY 2026.
Mid-to-late September 2026 brings the final 2027 Medicare Advantage and Part D landscape with actual plan offerings and average premiums. That is the first real look at how sponsors priced without the cushion and at how many plans remain. Anyone with a thesis here should treat that date as the moment the thesis becomes testable.
October 15 through December 7, 2026 is Open Enrollment for CY 2027, the first cycle under post-demonstration economics, with a diminished broker channel. Ten weeks, 25 million people, and whatever tooling exists by then.
December 31, 2026 the demonstration ends. January 1, 2027 the standalone market operates under traditional conditions, and the first pharmacy counter conversations about new formularies and new prior authorization requirements begin, roughly on schedule, in the first week of the month.
And 2029, when the 6 percent cap on base premium growth expires. Four years of suppressed price signal will have accumulated behind that date. Either it releases, or something replaces it, and both outcomes are worth positioning for now rather than in 2028
.